
Gang Gang
ANU first year graphic design project. Visual identity for gang gang cafe and bar.Gang Gang Cafe and Bar is a local Canberra business that serves food all week, but transforms into a bar and live music venue on Friday and Saturday evenings.
The visual identity aims to capture Gang Gang’s vibrant energy by combining dynamic lines and a black and white colour scheme, juxtaposed with a pop of red. The design incorporates hand-drawn elements that reflect the friendly, local atmosphere of the venue, creating a cohesive branding solution to appeal to Gang Gang’s diverse range of patrons.
The final outcomes included a logo suite, three posters for live music events, a menu that is cost-effective to print, and social media tiles.


Stitch Your Social Network
ANU Collaborative data visualisation project with katie anderson-kelly and alisha garrigues, 2022.Stitch Your Social Network is a project that leverages the personal data that Facebook is now legislatively required to make available to all users. The original purpose and context of this data was the commodification of our digital selves, a data footprint that captures the entirety of our interactions with a platform built to monetize our social relationships. Stitch Your Social Network seeks to reclaim this data, and explore how the relationships constructed in this data compare to our perceptions of these relationships "in real life".
The project uses embroidery as the medium for this exploration because it is a tactile craft that encourages the reflective and contemplative practice of slowing down. It provides the maker the time to consider their data outside of an online space.


Data Weaving
Science communication project, 2023. weaving with data. This creative piece is a woven table runner, made of overlaid temperature and threatened species data. It aims to bring to attention the impact rising temperatures will have on Australia’s wildlife and broader biodiversity.
While the data is accurate, it is not meant to be as precise or readable as other visualisations. Instead, it is designed to be a conversation piece. By being a functional, common household object, it may be placed at dinner events, in the lounge room, or in other social spaces to invite a deeper discussion.
These discussions are essential for small-scale science communication in the home, that can then be passed onwards into the more global discourse.
The pattern is also applicable to other region-specific data sets. It can be taken up by other weavers to create their own interpretation based on where they live, and what climate data they see as important in that region. By overlaying two data sets, the approach can be adapted to a wide variety of stories. In this way, the table runner acts as a prototype for what could be turned into a wider community engagement project in the future.
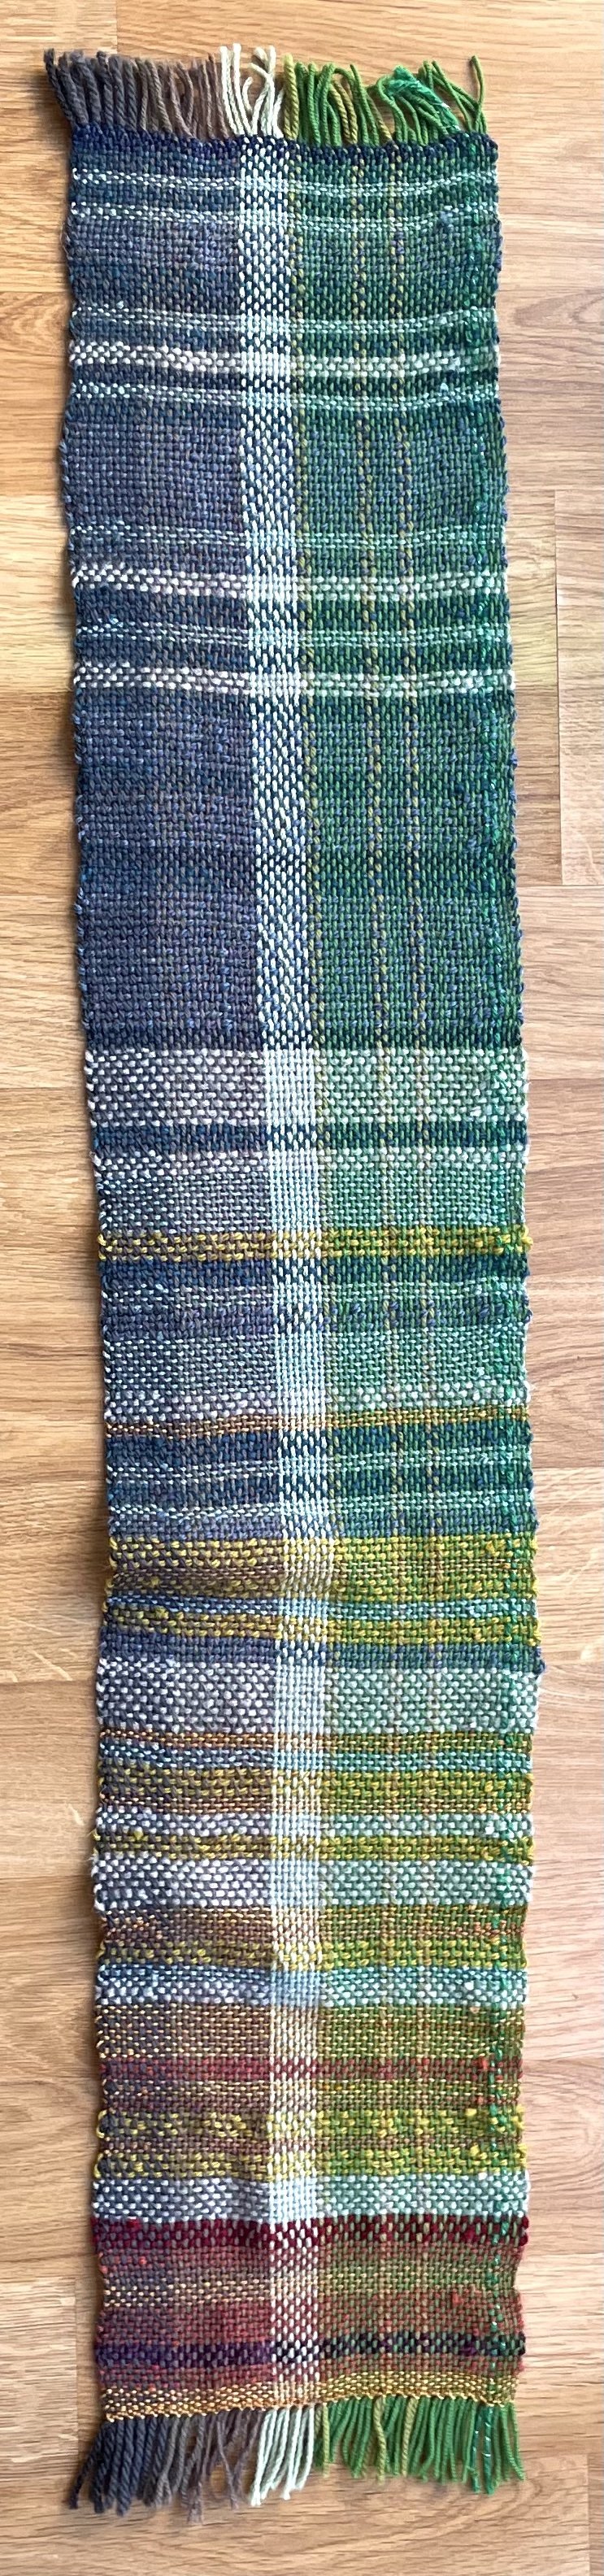
The climate data (weft) is inspired by the climate stripes, and
taken from the BOM (Bureau of Meteorology, 2023). It shows the annual mean temperature anomaly in Australia from 1917 to 2022. I arranged the data into bins in excel and assigned each value one of 12 colours.
The biodiversity data (warp) is similarly inspired by the biodiversity stripes which uses the Living Planet Index (LPI) as a data source (Richardson, 2022). However, the LPI does not have Australian- specific data, so I used an equivalent Australian index (Threatened Species Index, 2022). It shows biodiversity losses from near threatened to critically endangered terrestrial species between 1985 and 2018.


Kennedia macrophylla
ANU third year fabrication design project, 2023. Autoembroidery machine and laser cutter. This project reveals the unseen structures of leaf veins by extracting a photo of a native leaf on a lightbox, and converting it to an automated machine embroidery file. The files were run on dissolvable fabric. The outcomes combine to share the story of Kennedia macrophylla: a endangered species that is threatened by changing bushfire regimes which are becoming more frequent and severe under our changing climate.


